


Turning fragmented data into unified BI.
Meta needed a scalable way to unify vendor data across partners. Inconsistent formats, manual reconciliation, and disconnected reporting slowed decisions and increased operational effort. Loymark transformed fragmented information into a trusted, automated intelligence ecosystem.
01 / THE CHALLENGE
Fragmented Data Slowed Better Decisions.
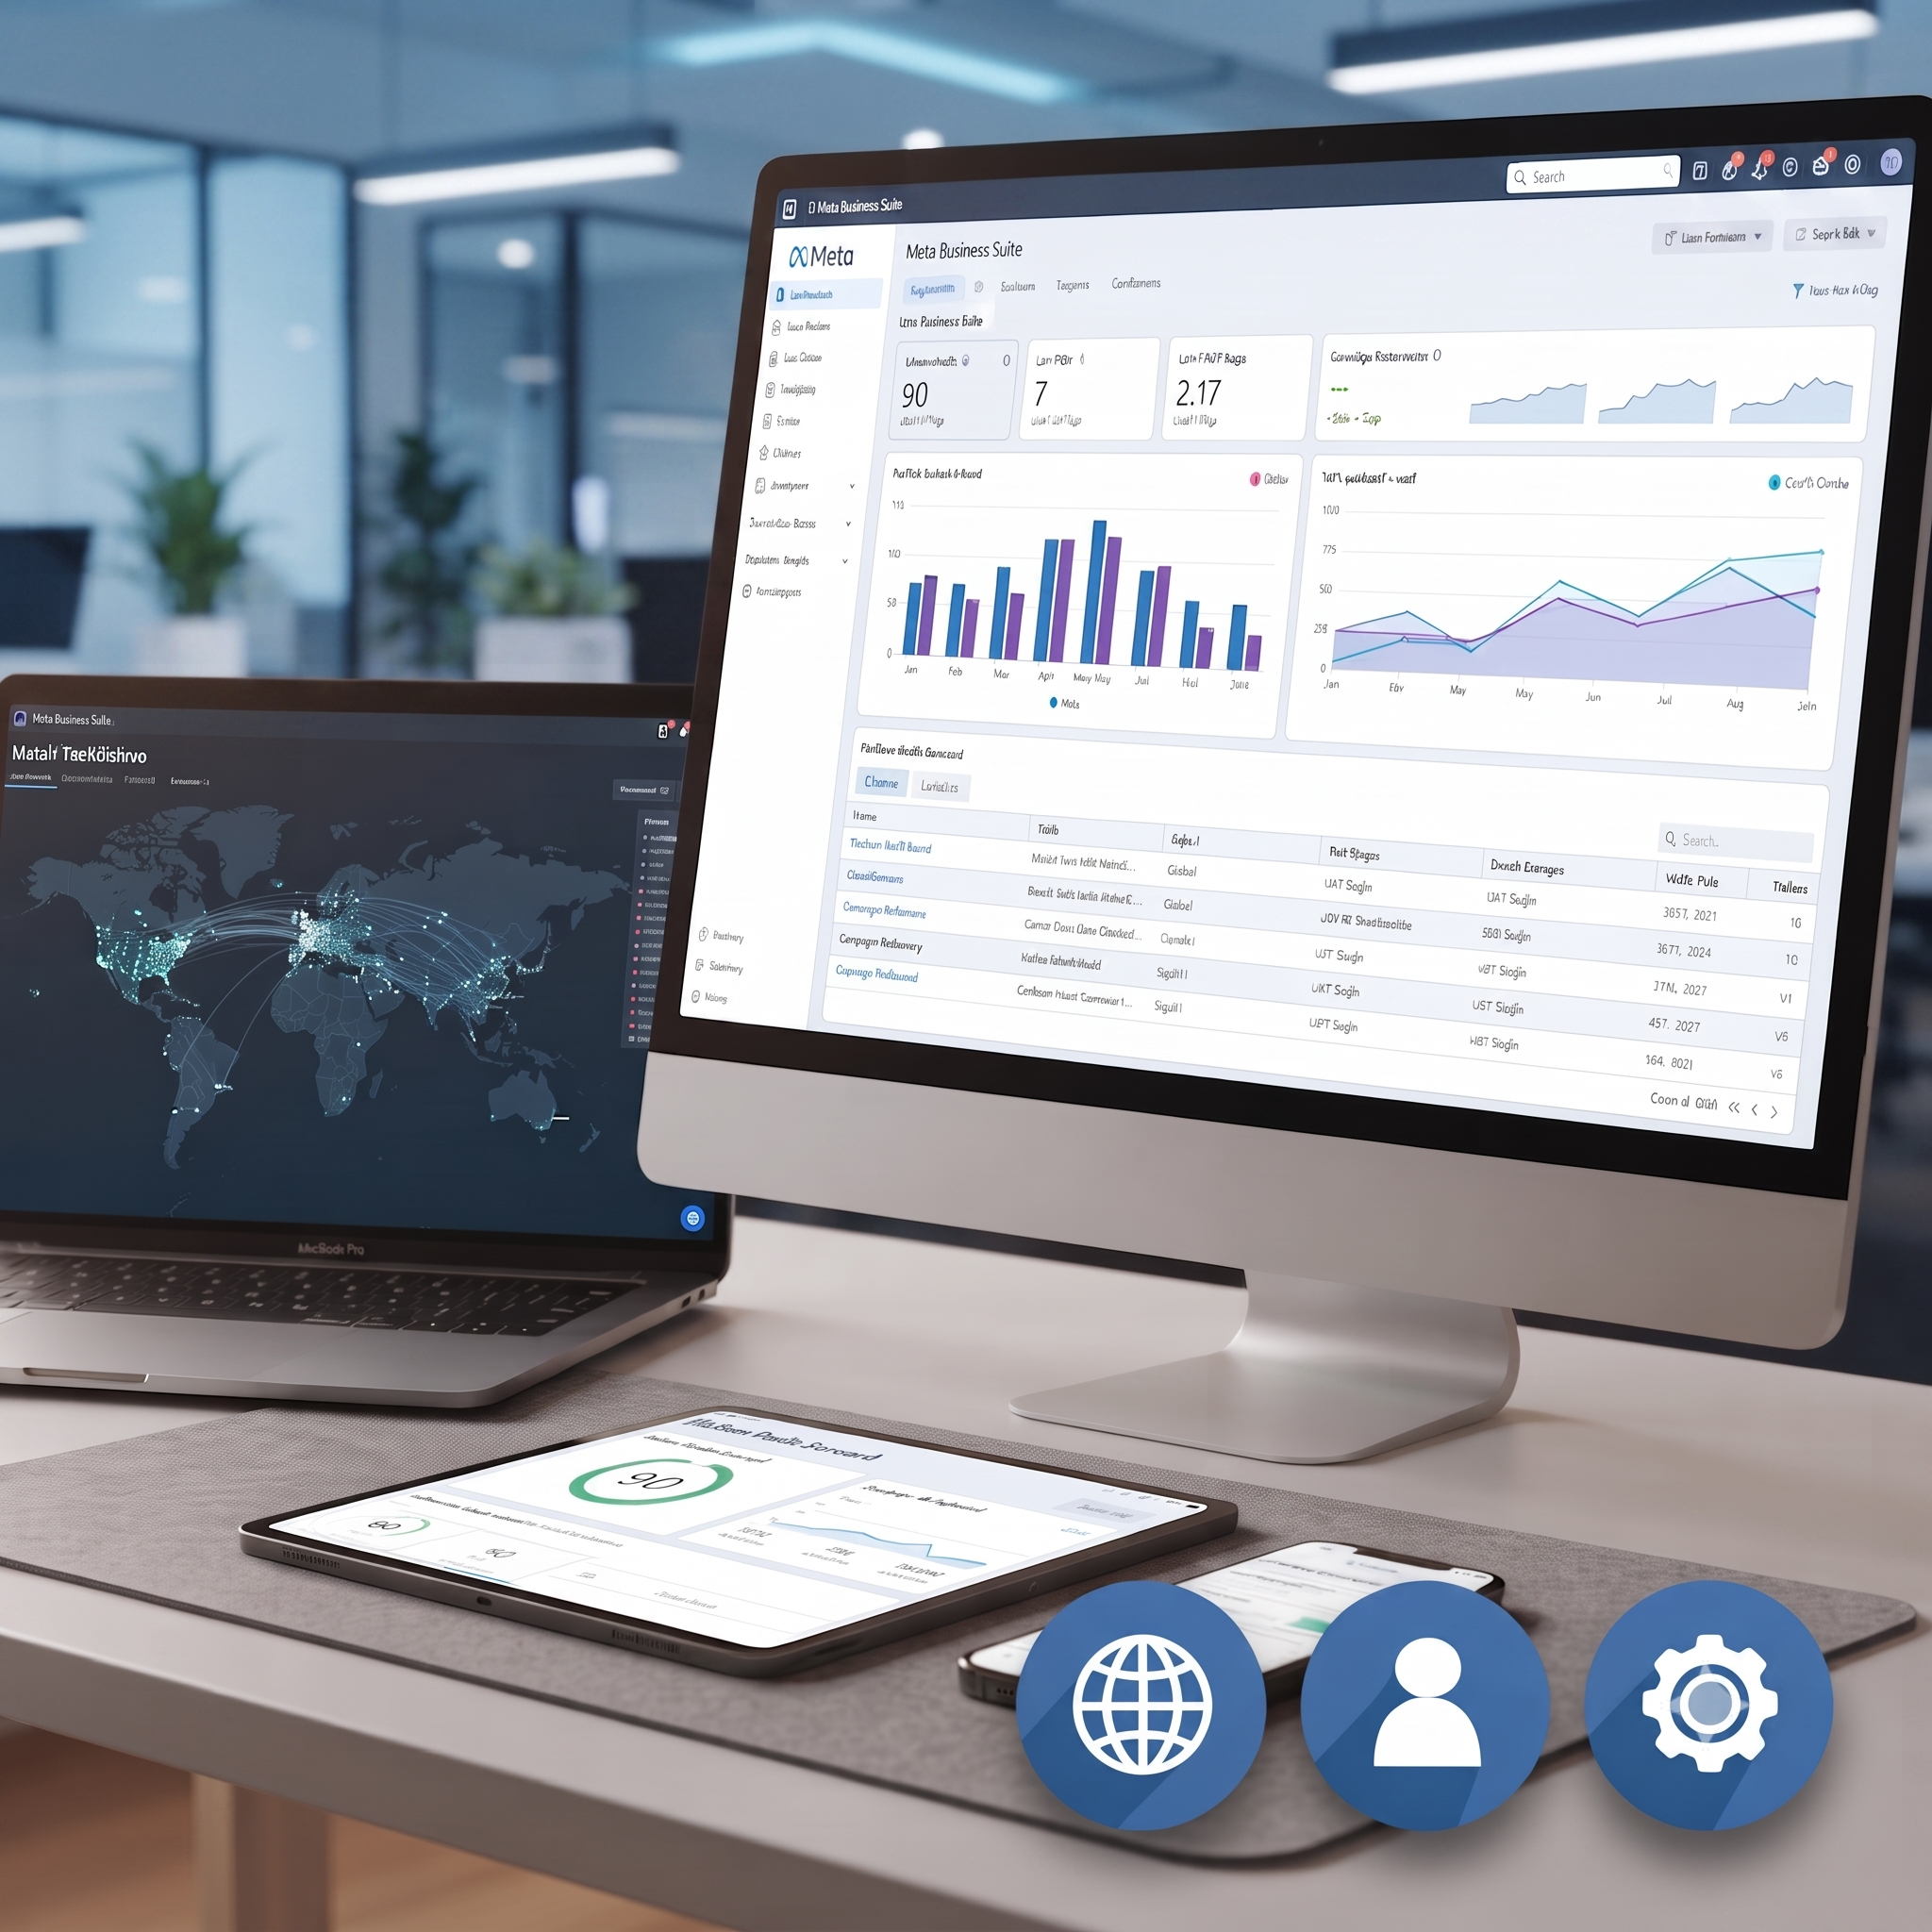
Vendor data came from multiple partners in different formats, forcing teams to spend countless hours reconciling information instead of acting on it. Without a single source of truth, reporting was slow, collaboration suffered, and leadership lacked timely, reliable insights.
How could Meta turn fragmented vendor data into faster, smarter decisions?

02 / THE SOLUTION
From Data Fragmentation to Shared Intelligence.
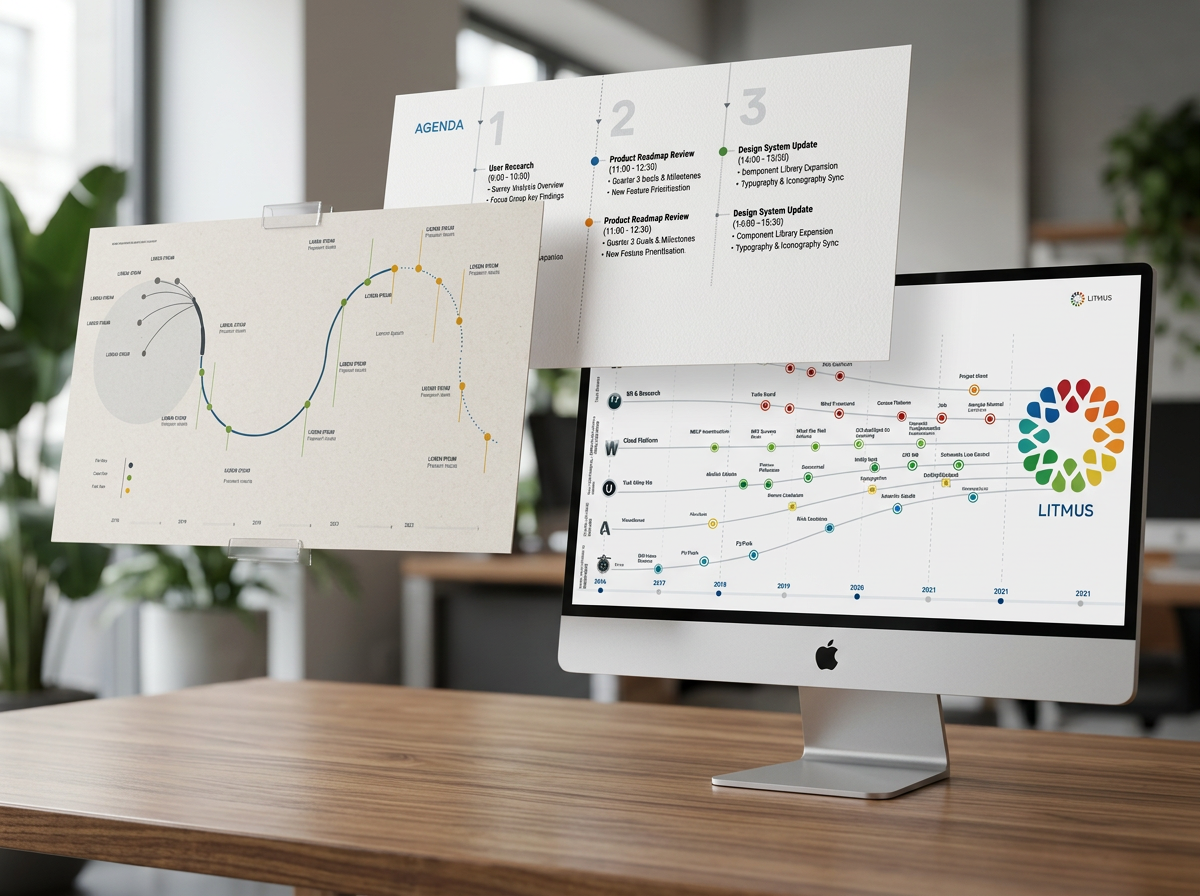
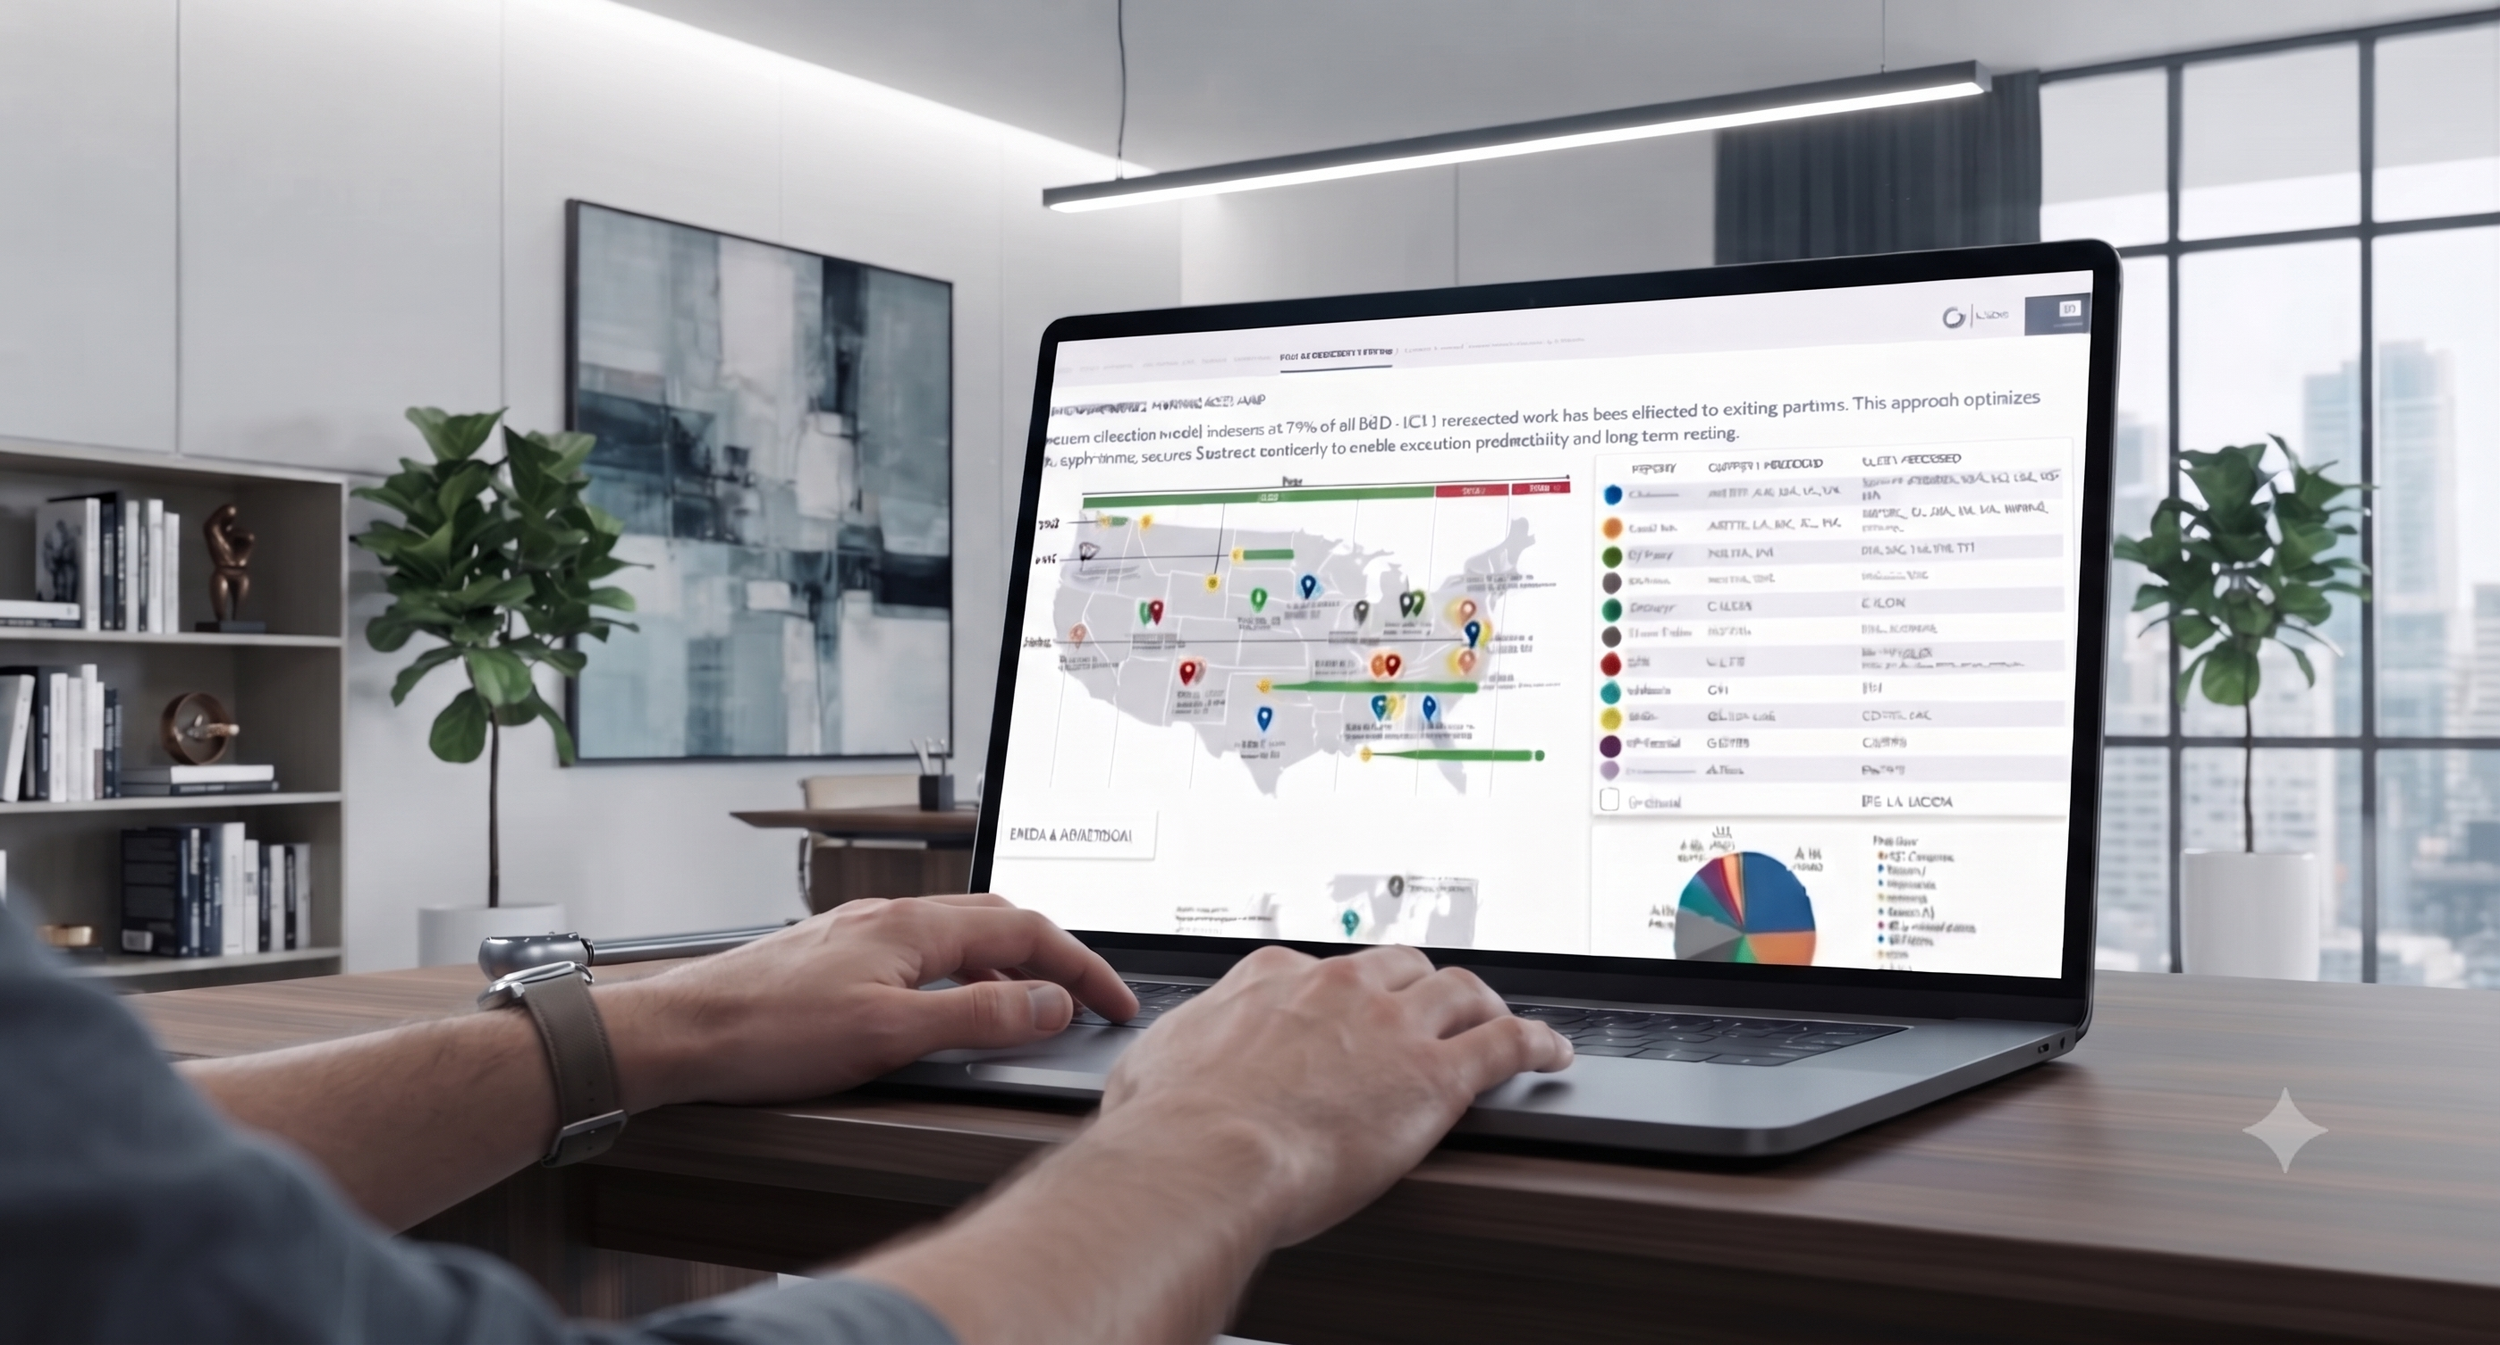
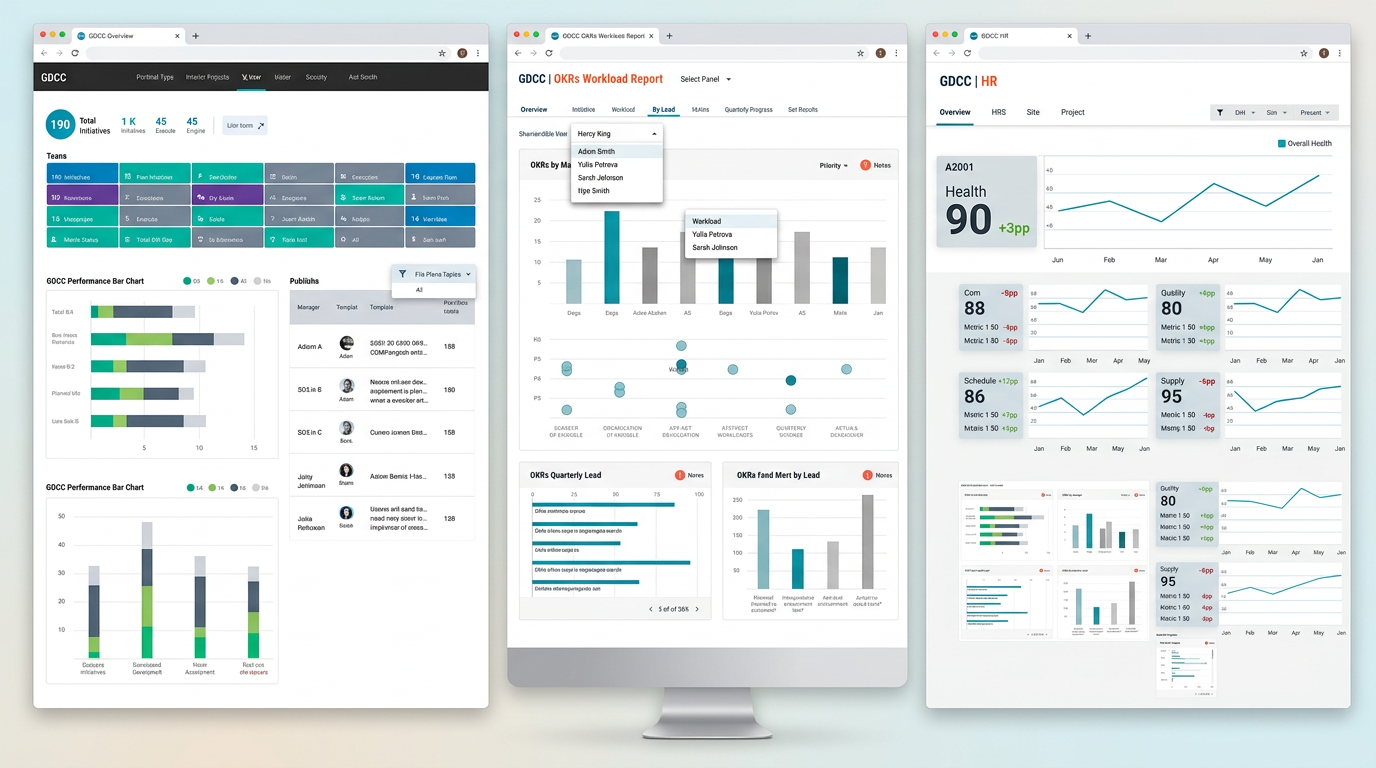
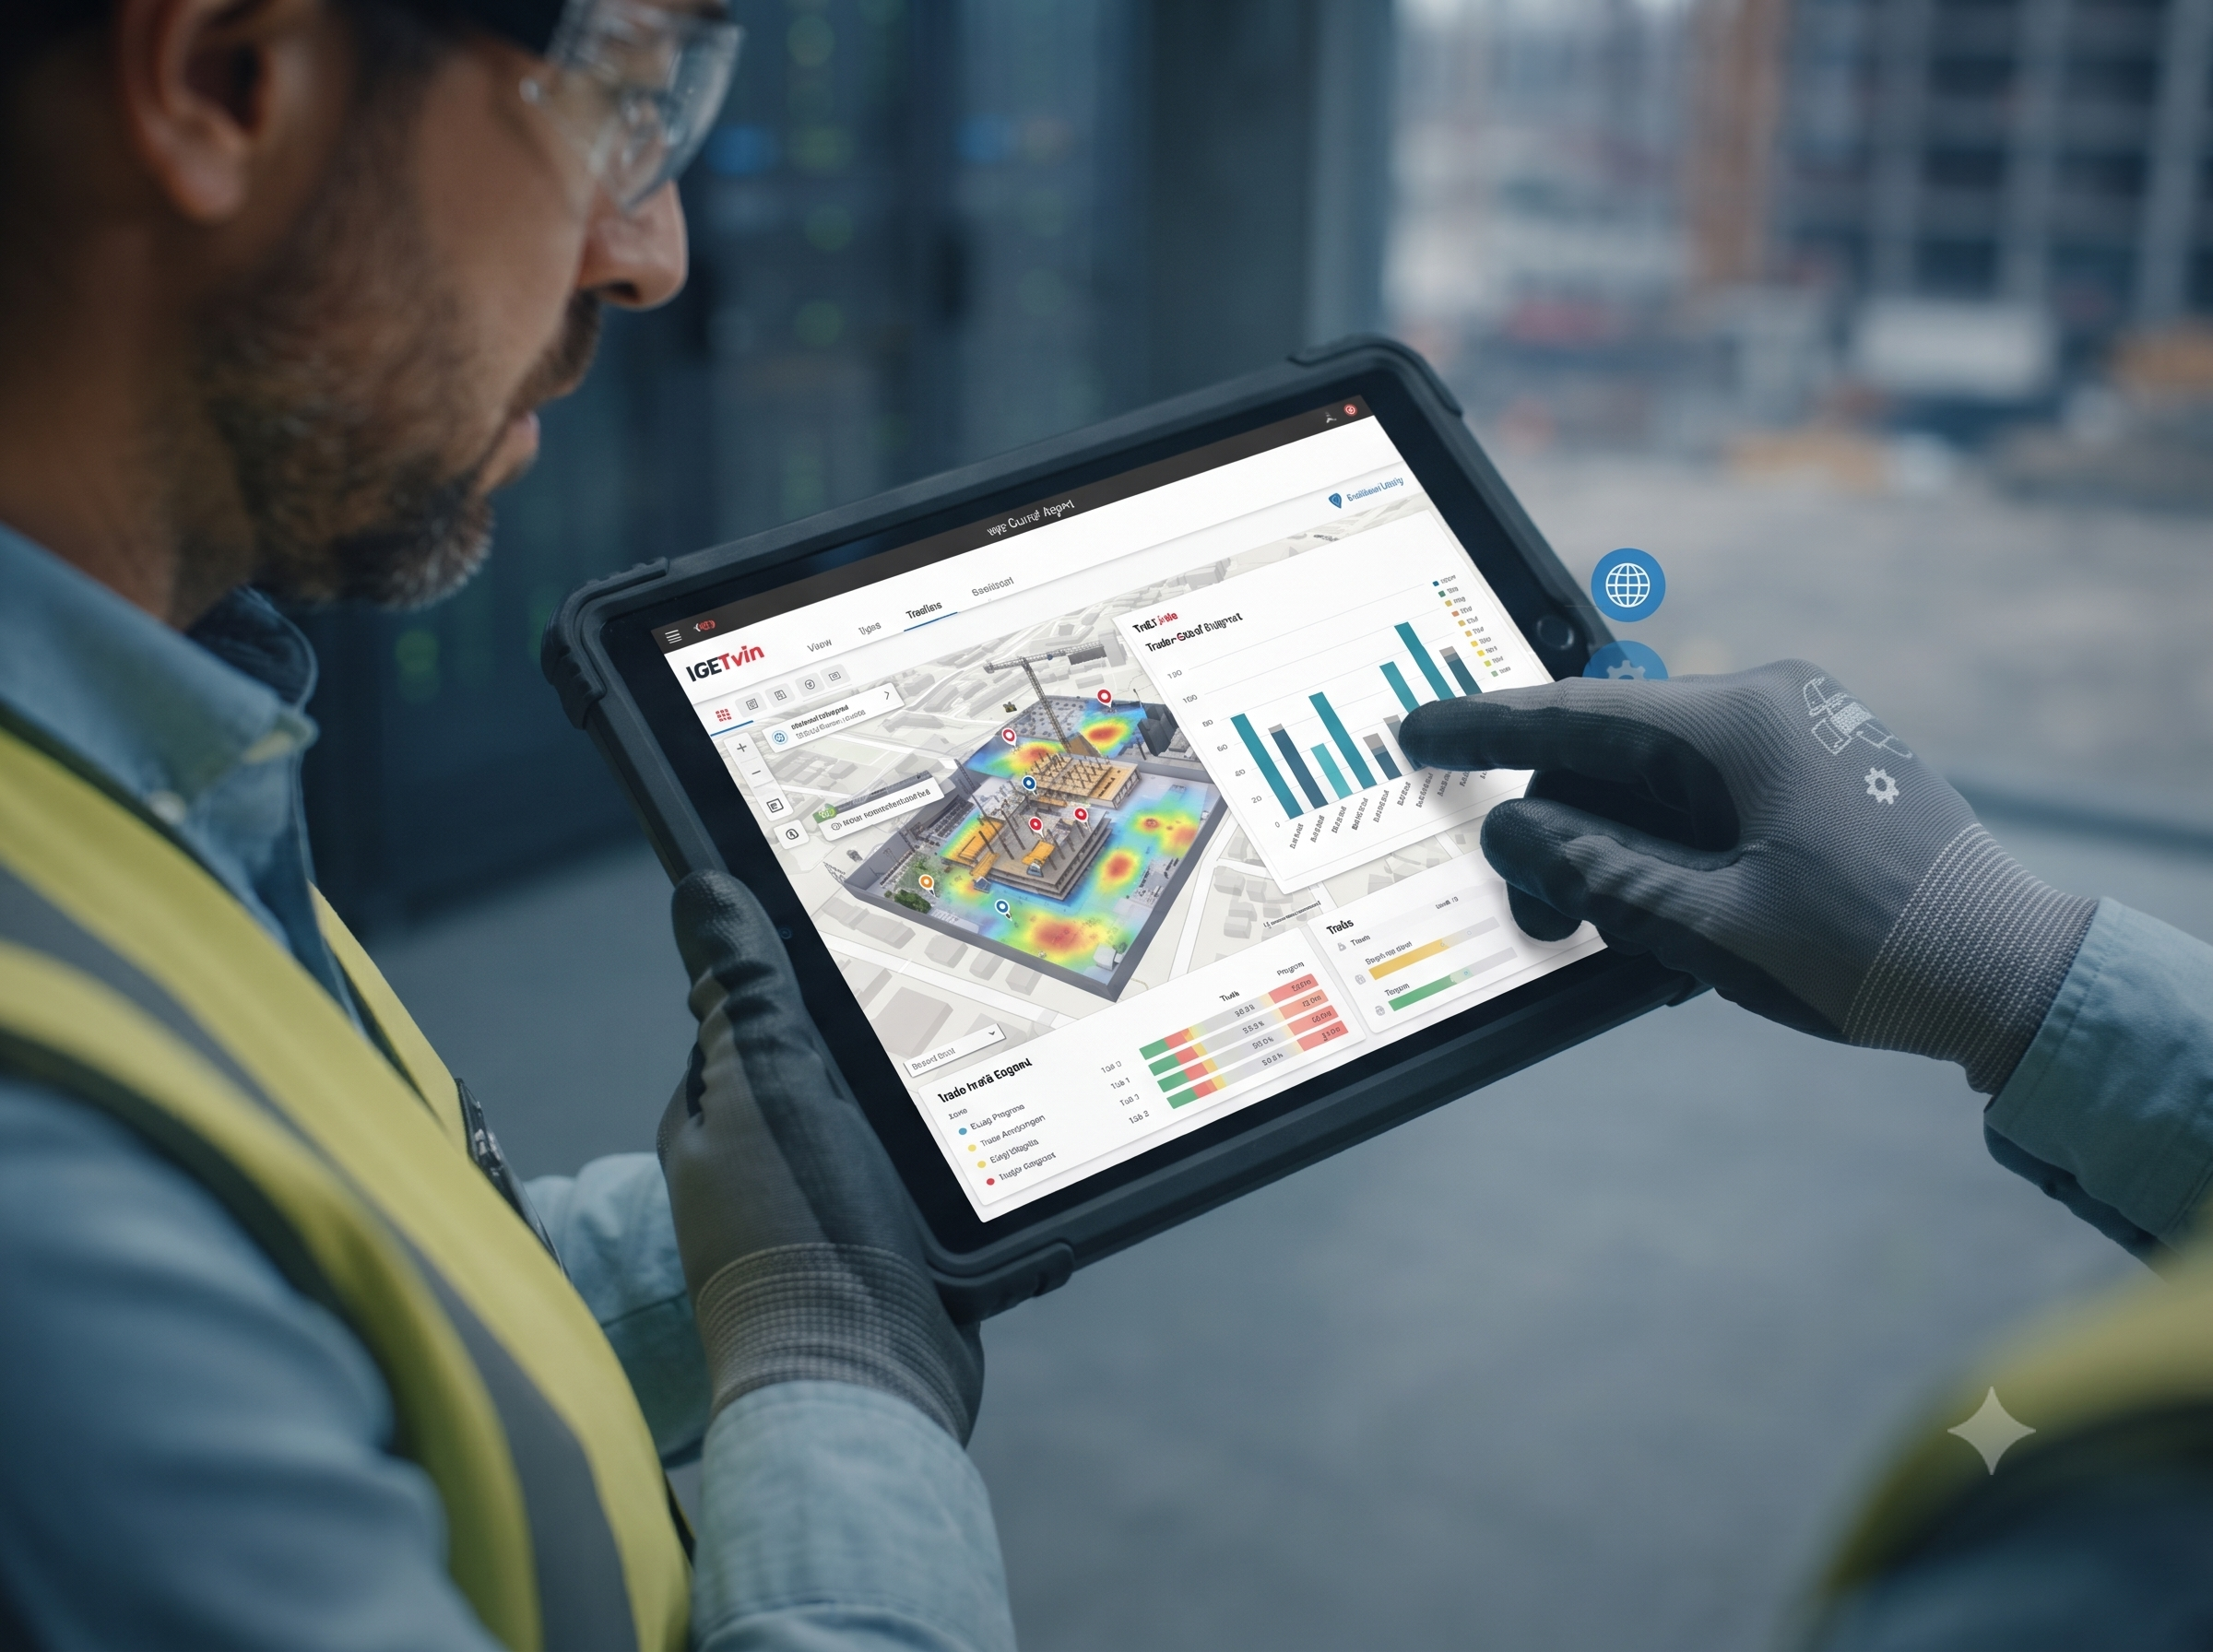
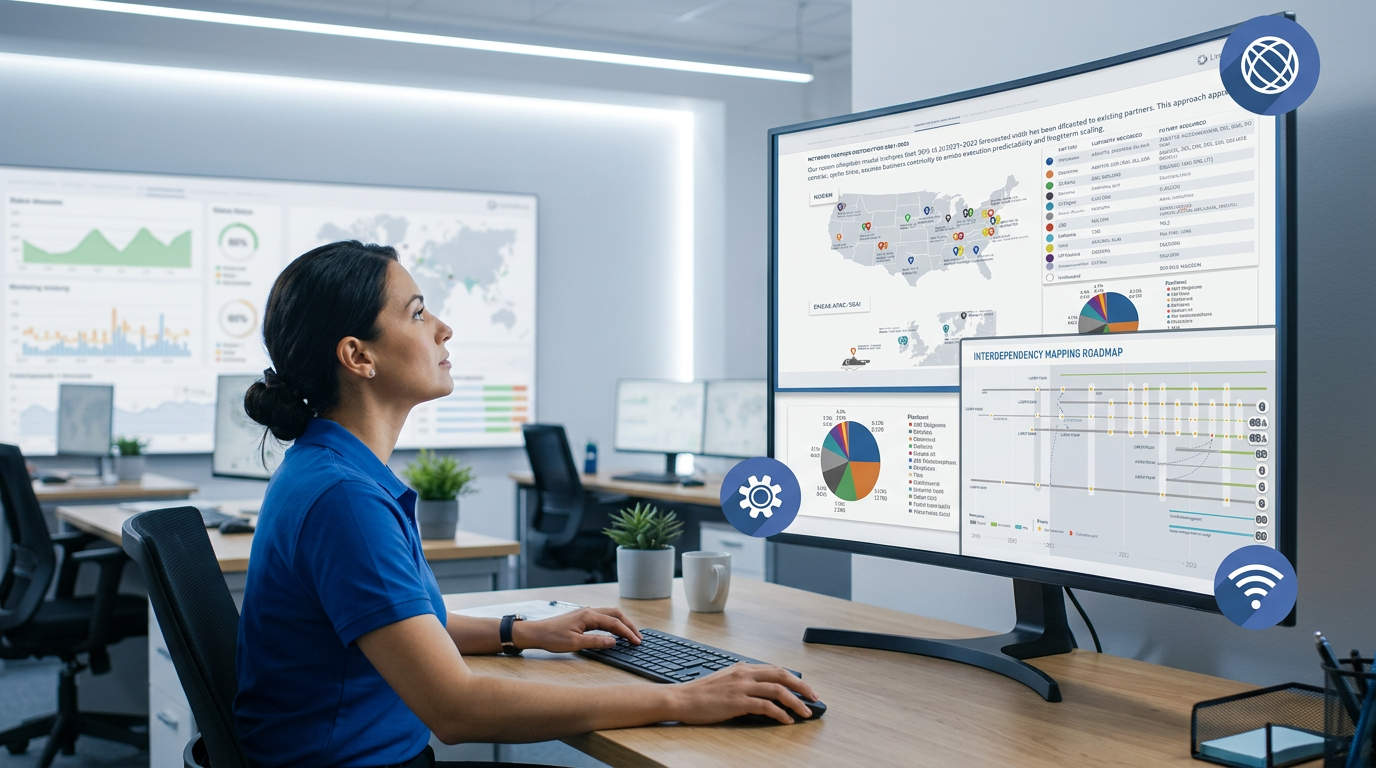
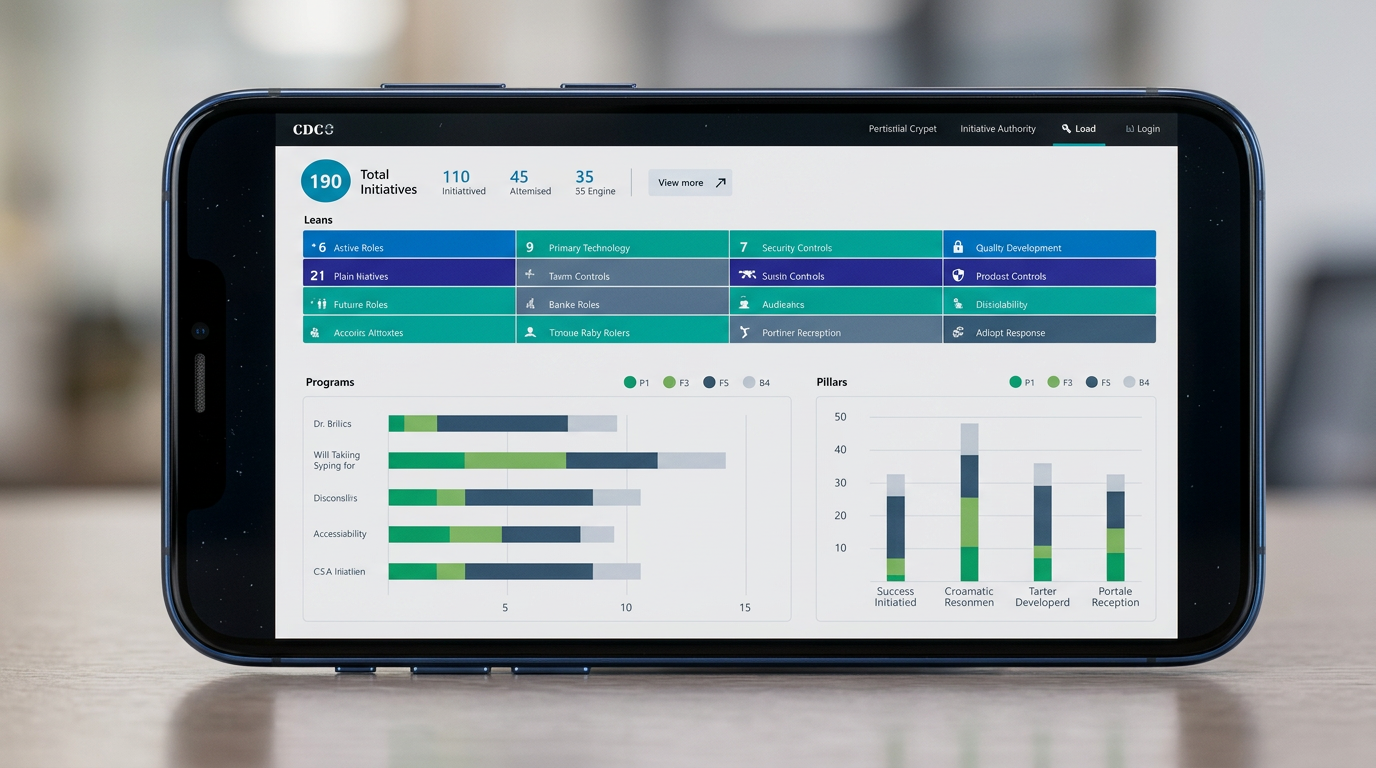
We integrated vendor data into a standardized ecosystem, automated critical workflows, and created real-time dashboards that enabled cross-partner collaboration. What began as a reporting initiative became a scalable operating model for vendor governance and decision-making.
Good data is always the foundation for faster decisions and scalable collaboration.
03 / THE RESULTS
A new operating model that transformed vendor management through trusted data and automation.

The right data strategy turns operational complexity into business clarity.
Let´s design the future of customer engagement and start building a smarter, data-driven growth engine.

GROWTH PARTNERS
Trusted by Brands That Move Markets.


